
1.3. Equations as tree topology
The equations for calculating the value of the output quantity, as being set up in section 2.2.1, are hierarchical equations. They form a list of dependent quantity (of number nab), followed by the list of independent input quantities (of number nmu). Therefore, numbers from 1 to (nab+nmu) are attributed to the quantities. This list may be considered as if it were a ladder with (nab+nmu) steps, or a decay scheme of a decaying atomic nucleus; on each step (or level) a quantity symbol resides. According to their associated auxiliary equations, the dependent quantities are related with other symbols on lower positions of the ladder (or level). Connecting these symbols by lines generates a tree structure, which is comparable to a series of allowed level transitions of a decaying atomic nucleus. The series of connecting lines down to the ladder step of an independent input quantity can be compared with a cascade of level transitions of a nucleus ending at the ground state level.
The following is restricted to applications not using linear unfolding.
Such “symbol cascades” can be generated from all “transitions” (i, j)=ij between symbols i and j within a cascade. They can be found by using a recursive numerical algorithm.
This method is especially applied to find out for a net count rate Rn, being proportional to the output quantity value, on which individual count rate contributions Ri it depends. Furthermore, the count rates Ri have two additional properties:
a square-root-based uncertainty function like sqrt(Ri/ti) can be attributed to them, or,
they may be based on count numbers Ni, also being associated with uncertainty formulae like (sqrt(Ni)), or for which special distribution types are declared, e.g., the gamma distribution (“x+1”) or a Poisson/binomial distribution.
With taking these additional properties into account (called “rules” below), in most cases those symbols can be identified, which represent a count number, including also the associated counting duration. Then, by going one step back within the affected hierarchy ladder, the symbol representing the associated count rate Ri=Ni/ti is found.
Knowing the relation between the gross count rate Rg, the gross count number Ng and the counting duration tg, and their symbol numbers within a cascade, allows, for deriving decision threshold and detection limit, to generate a modification from Rg to \(\tilde{R}g\) from the related modification from Ng to \(\tilde{N}g\). For simplification of this step, index fields are generated within UncertRadio which point from a count rate to the number of counts and to the counting duration, and vice versa. This, however, requires that not only count rates Ri alone are applied in the equations, but they should also be defined explicitly by Ri=Ni/ti. This results in the recommendation, to apply this in working with UncertRadio.
Example Ra226_U235-at-186keV_EN.txp:
Equations (nab=8, nmu=10):

Formeltext=
1 : cRa = Phi * RRa
2 : Phi = 1. / (eps * pRA * mp)
3 : RRa = RS - RU5
4 : RS = Rb - RT - RnNE
5 : RU5 = AU5 * Ufakt
6 : Ufakt = eps * pU5 * mp
7 : Rg = Ng / tm
8 : RT = NT / tm
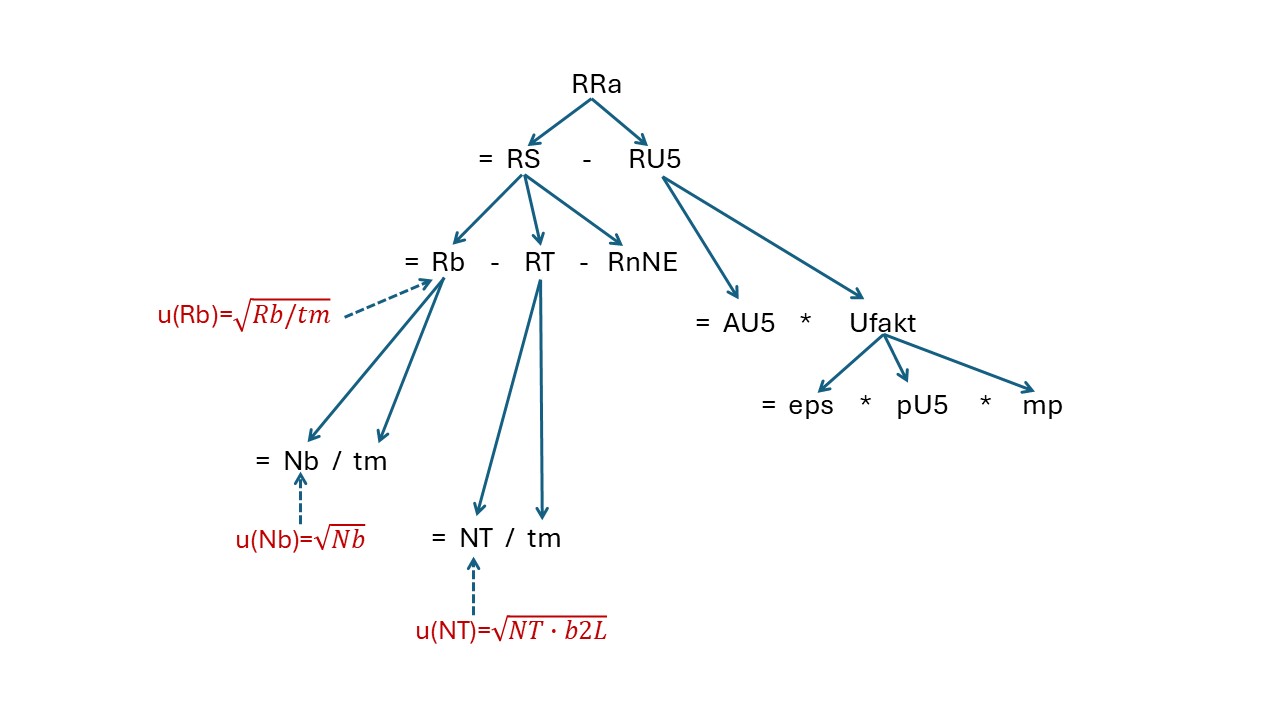
Table of transitions i rightarrow j:
nd i  j Symb(i) Symb(j)
-----------------------
1  3  4 RRa     RS
2  3  5 RRa     RU5
3  4  7 RS      Rg
4  4  8 RS      RT
5  4 12 RS      RnNE
6  5 13 RU5     AU5
7  5  6 RU5     Ufakt
8  6  9 Ufakt   eps
9  6 14 Ufakt   pU5
10 6 11 Ufakt   mp
11 7 15 Rg      Ng
12 7 16 Rg      tm
13 8 17 RT      NT
14 8 16 RT      tm
Table of cascades (chain) and three identified count rates as part of the net count rate:
nc i  j kcnt ktime krate rule Symbol   chain
------------------------------------------------
1  7 15 15   15    7     A5   Rg       3 4 7 15
2  7 16 0     0    0                   3 4 7 16
3  8 17 17   17    8     A3   RT       3 4 8 17
4  8 16 0     0    0                   3 4 8 16
5  4 12 0     0   12     A6   RnNE     3 4 12
6  5 13 0     0    0                   3 5 13
7  6  9 0     0    0                   3 5 6 9
8  6 14 0     0    0                   3 5 6 14
9  6 11 0     0    0                   3 5 6 11
Table of index fields of counting duration (iptr_time) and number of counts (iptr_cnt) to the count rate (iptr_rate)
(RnNE is defined only as a net count rate of the background measurement)
i iptr_time iptr_cnt iptr_rate Symbol
---------------------------------------
7     16       15        7       Rb
8     16       17        8       RT
12     0        0        0       RnNE
Among the example projects belonging to UncertRadio are two, for which the algorithm shortly introduced above in fact finds specific count rate symbols two times:
BSH_total-gamma_var2_EN.txp
DWD_sr89_sr90_TDCR_procedure_EN.txp
In the first one, this result leads to the conclusion, that the equations constituting the net count rate, have not been simplified enough. In fact, it can be demonstrated that the corresponding equations can be re-worked algebraically such that the equations of the alternative example, BSH_total-gamma_var1_EN.txp, are exactly met.
In the second example mentioned above, the equation for Rn_s for calculation the Sr-90 activity is rather complex, so that both, R0_s and R0_c, appear twice in them, also in a non-linear form.
Note
While running the QC batch mode processing an additional file fort.64 is produced showing in short form the identified count rate contributions to the net count rate (projects not using linear unfolding). Meanwhile, this option is deactivated.
Hint
The example given above shows that the gross count rate Rg is the first in the list of count rates contributing to the net count rate. This characteristic can be used for the internal checking whether the correct gross count rate symbol has been selected within the TAB “Equations”, because the gross count rate is always the first of the count rates in the expression for the net count rate.
