
4.9. Using data sets for mean and variance
4.9.1. Mathematical background
Formulae for a mean value and its associated variance presented here are derived by Bayes statistics. Their derivation was described by Weise et al. (2013) in their section 5.8 and their appendix C. Two cases a) and b) are considered (see also Table 2 in Gross quantity: Variance interpolation for a mean):
Unknown random influences:
Mean type 1. For any input quantity \(x\), which does not represent a number of counts, the variance of m individual values is derived from the experimental variation:
Hierein are:
Mean type 2. An input quantity n represents a number of counts and is influenced by an additional variation, e.g., due to repeated sampling and/or chemical analysis, which enlarges the Poisson-derived variance. A normal distribution with parameters \(\mu\) and \(\sigma^{2}\) is assumed for this influence. The variance of the mean is then given by:
(4.9.3)¶\[u^{2}\left( \overline{n} \right) = \frac{1}{m}\left( \overline{n} + \frac{(m - 1)}{(m - 3)}{(\overline{n} + s}_{n}^{2}) \right) = \frac{1}{m}(\overline{n} + E(S^{2},\mathbf{n}))\]\(\overline{n}\ \) and \(s_{n}^{2}\) are calculated analogue to \(\overline{x}\ \) und \(s_{x}^{2}\). The variance component
(4.9.4)¶\[E\left( S^{2},\mathbf{n} \right) = \frac{(m - 1)}{(m - 3)}{(\overline{n} + s}_{n}^{2})\]is considered as the best estimate of the parameter \(\sigma^{2}\) of the involved normal distribution. The first term in the bracket of Eq. (4.9.2) , \(\overline{n}\) , represents the Poisson-related part of the variance.
Applying these formulae leads to surprising result that a variance can be calculated only if there are more than three individual values.
Mean type 3. With version 2.3.01 the classical formula for the standard uncertainty of the mean can be applied
if the type of mean “classical“ is selected.
Known random influences:
If the fraction of (4.9.4) within (4.9.3) is small, a parameter \(\vartheta\) can be defined as:
\(\vartheta^{2} = E\left( S^{2},\mathbf{n} \right)/{\overline{n}}^{2}\)
by which Eq. Gl. (4.9.4) turns into:
By solving Eq. (4.9.4) for \(\vartheta^{2}\), an equation is obtained, by which \(\vartheta^{2}\) can be determined from the data set of measurements of a reference sample \(r\):
The parameter value \(\vartheta\) should be less than about 0.2.
4.9.2. Applying means in UncertRadio
If in the symbol list under the TAB “Equations” a symbol type is changed
into „m“, the program assumes that value and uncertainty of this
quantity are to be derived from a data set. The following input dialog
allows the input of the data set, it is invoked by the icon  from the toolbar (it requires first selecting the row of this “m”
variable in the TAB “Values, Uncertainties”):
from the toolbar (it requires first selecting the row of this “m”
variable in the TAB “Values, Uncertainties”):
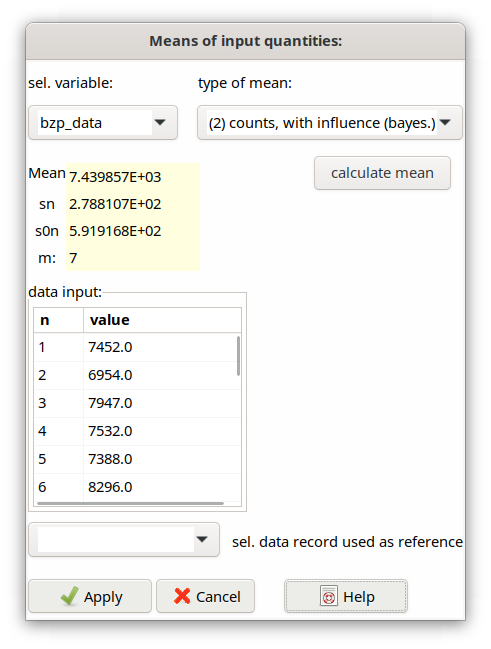
Fig. 4.9.1 Dialog for variable average
The id values for the data sets are already known here. In the dialog shown, the id ref_data (belonging to the input quantity ref) is selected for data input. Besides, the type of mean and variance can be selected from equations (4.9.1) and (4.9.3). For the extreme case that there are not more than only 3 single values, or the data shall be evaluated in a classical sense, the variance according to Eq. (4.9.5) can be chosen as third option. The latter can also be used for more than 3 single values. In the dialog shown, the standard deviations sx and s0x correspond to equations (4.9.1) und (4.9.2) in Section 4.9.1.
The combobox indicated in the dialog by the label “sel. data record used as reference“ allows to select one of the mean datasets, which is intended to be used as a reference in the case of “known random influences”. An example project is ISO-Example-2b_V2_EN.txp. If no reference data set is selected, the evaluation follows that of the option “unknown random influences“. The details for these options are outlined in Section 4.12.
Values of mean and uncertainty of such a data set are transferred by the program to the uncertainty table under the TAB “Values, uncertainties“ by the button “Calculating uncertainties”.
The individual values of this quantity with a name symbol are saved in the project file (*.txp) as a single line record identified by the associated identification (symbol_data).
For organizing the data input it is recommended to begin with data input into the TAB “Values, Uncertainties”. For mean variables characterized by „m“ as type the „t distribution“ is to be selected as distribution type which enables a correct statistical treatment of the mean within the mean dialog. Then, the mean dialog can be opened in which the desired mean variable is selected; after input of associated singe values the type of mean is selected which then can be calculated. After leaving the dialog the calculation of uncertainties needs to be updated/repeated.
The input of single values in this dialog was modified such, that after input of a value the next cell is already opened for input. It happens that the activated cell appears to be moved a bit away from the grid cell, however, the value entered (finalized with Enter or cursor-down) is transferred into the original grid cell. The input of values is then finalized with typing Enter into the activated cell, which must be empty for this purpose.
